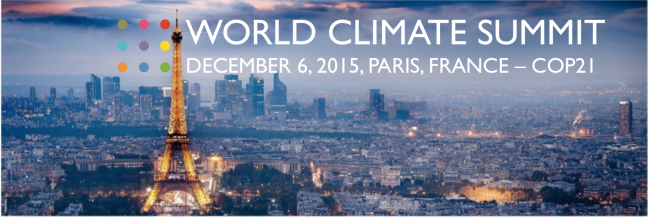
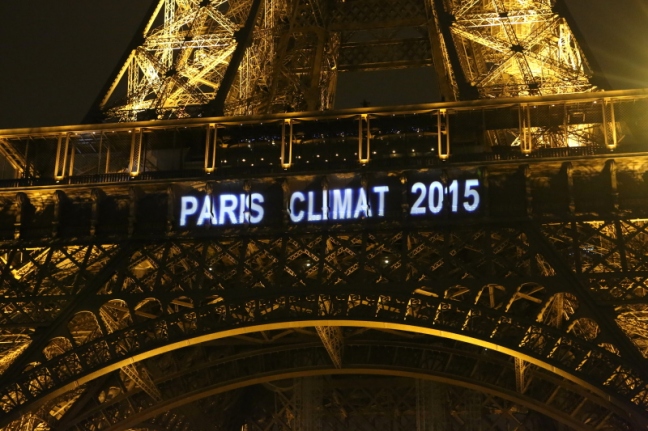
The Paris Conference – Goals on Climate Change

Paris Climate 5

What is the COP21?

France will chair and host the 21st Conference of the Parties to the United Nations Framework Convention on Climate Change, from 30 November to 11 December 2015. The conference is critical because the expected outcome is a new international agreement on climate change, applicable to all, to keep global warming below 2°C.

Why 2°C?

According to the IPCC, Intergovernmental Panel on Climate Change, global warming of more than 2°C would have serious consequences, such as an increase in the number of extreme climate events. In Copenhagen in 2009, the countries stated their determination to limit global warming to 2°C between now and 2100. To reach this target, climate experts estimate that global greenhouse gas emissions need to be reduced by 40-70% by 2050 and that carbon neutrality (zero emissions) needs to be reached by the end of the century at the latest.

Paris Climate 1

What you need to know:

The Paris Climate Conference this week may attempt to set ambitious, but meaningless goals to try and combat global warming. The Paris Conference has been going moderately slowly and smoothly. As if to emphasize just how optimistic world leaders are feeling, negotiators released a draft agreement on Thursday that actually puts forward a more ambitious goal for global warming than many had expected going into the conference.

The draft that was released established that the main goal is to maintain the increase of the global average temperature to well below 2 degrees Celsius. In these efforts recognizing that this would significantly reduce risks of and impacts of climate change.

Paris Climate 2

The argument was the acknowledgement that some people will suffer more than others at 1.5 degrees of warming that doesn’t go so far as to set a new target. The real problem is it’s an empty gesture, serving as a reminder that when politicians aren’t on track to meet one of their climate goals, they will offer an even less realistic one.

Paris Climate 3

One of the most unexpected developments in Paris is the biggest polluters coming around to the idea of setting an even more ambitious target of 1.5 degree. Canada, Australia, European countries, China, and the United States have all spoken in favor of identifying the damage above 1.5 degrees. “We need a recognition of 1.5 in the agreement,” U.S. climate envoy Todd Stern said in a comment about the Paris Conference.

Paris Climate 4

This debate is frustrating to think about because it reinforces all the doubt that’s surrounded global action on climate for decades. Countries find it easy to compromise on lofty goals, supported by a draft with many empty promises.  Thursday’s text, for example, also says parties aim to reach peak greenhouse gas emissions “as soon as possible”. This provides no validation that this problem is going to be solved anytime soon. The outcome will determine and be observed later in our lifetimes whether the Paris deal is a major milestone in the fight against climate change, or a meaningless document full of little more than high-minded rhetoric.

For more information go to:

http://unfccc.int/meetings/paris_nov_2015/meeting/8926.php

http://www.cop21paris.org/about/cop21

http://www.cop21paris.org/


Impacts of El Nino

el nino pic 1

El Niño at its simplest form is the warm phase of a reoccurring fluctuation in the temperatures of the eastern Pacific Ocean near the equator. When these waters are warmer than normal, it is classified as an El Niño. When they are cooler than normal, a La Niña sets in. Sea surface temperatures from a section in the middle of the El Nino are considered a benchmark for the strength rating. That strength is determined by the sea surface temperature.

el nino pic 4

All eyes are on the El Nino episode in the Pacific Ocean, which had hit an all-time record. Over the past week, it hit above three degrees Celsius, beating the previous record of above 2.8 degrees Celsius during the 1997 “Super El Nino”. These waters should begin gradually cooling as the El Nino is forecast to weaken over the next month. It will interesting to see if the typical El Nino shifts in the weather pattern develop over the next few months, do to expectations being only viable until we actually experience the effects.

el nino pic 3

El Nino, which historically has spawned storms and droughts and devastated crops and homes elsewhere in the country, has returned this year, stronger than ever, and some of its “milder” effects are being felt. For example, a low-pressure system fueled by El Nino two weeks ago doused the West Coast and dumped sizable amounts of snow in Iowa and Illinois but, by the same token, it stalled and weakened the storm’s snow potential in New York State, meteorologists said.

el nino pic 5

NOAA explains that the warm Pacific and trade winds are shifting, which all signs are pointing to a significant El Nino winter. They said the last really good El Nino winter was in 1997-98. The report increases probabilities for a stronger El Nino with greater longevity to last through this coming winter. If this occurs, it would lessen probabilities for another excessively cold winter in the western New York region and increase probabilities of a milder than average winter. Scientists said they are still not sure if the El Nino winter would end the drought.

el nino pic 2

The developing El Nino that most say will cause havoc around the globe is showing features that have already begun rivaling the notorious 1982-83 El Nino, which killed 2,000 people and caused $13 billion in economic losses.

The strength of this year’s El Nino has resulted in a quiet 1997 hurricane season, contrary to pre-season predictions. The strong winds caused by the El Niño’s help weaken the forces that cause hurricanes to develop.

Rochester and a good portion of Western New York has a big winter to look forward to. Local meteorologists are predicting that what’s already being called El Nino of the century may bring Rochester more freezes and snowfall than the city has had since 1982-84, the years of the last powerful El Nino.

For more imformation:

http://www.elnino.noaa.gov/

http://www2.ucar.edu/news/backgrounders/el-nino-la-nina-enso

http://www.weather.com/forecast/national/news/winter-2015-2016-what-to-expect


A Glimpse into the Oswego River/ Finger Lakes Watershed

watershed 1

Background

The Oswego River Basin in central New York State contains a diverse system of streams, lakes, and canals. The Oswego River Basin has an area of 5,100 square miles and contains three physiographic provinces—the Appalachian Plateau, the Tug Hill Plateau, and the Lake Ontario Plain.

The Oswego River/Finger Lakes Watershed is one of the largest in New York State and includes the drainages of the Oswego, Oneida, Seneca and Clyde Rivers. The watershed includes most of the New York Finger Lakes; in fact, the lakes make up about 6% of the total surface area of the watershed. The size of this watershed is 5,070 square miles of land area entirely within New York State. There is 8,896 miles of freshwater rivers and streams and 76 substantial freshwater lakes, ponds, and reservoirs.

watershed 2

Geography

Surface water and ground water in the Oswego River Basin courses from upland watersheds to rivers and lakes and then to the troughs encompassing the main stem of the New York State Barge Canal. During some major storm-runoff periods, the water surface elevation in the Barge Canal near Montezuma (downstream from the Cayuga Lake outlet) has surpassed the water-surface elevation in Cayuga Lake. The area near Montezuma receives about 48 percent of the runoff from the Oswego River Basin’s 5,100 square miles. Further downstream (to the east), the canal obtains additional water from the Owasco, Skaneateles, and Otisco Lake watersheds, which, like Canandiagua Lake to the west, are at higher elevations and drain freely to the Clyde/ Seneca River trough.

watershed 3watershed 4

Not a Floodplain Problem, but a Watershed Concern

The quantity of water that enters any Finger Lake from a storm is contingent on local watershed conditions. For example according to the USGS (United States Geological Survey), when soils are saturated or frozen in the Cayuga Lake watershed, for every inch of water that falls on the watershed and runs off to the lake, the lake level increases by one foot within 1 to 2 days, but once in the lake, this amount of water can take a week or more to fully drain to the Barge Canal because the lake level can be lowered by only a tenth of a foot per day due to the low gradient of the Seneca Rive/Barge Canal and the difference in elevation between the River and Cayuga Lake.

Major water quality concerns in the watershed are the Legacy Industrial discharges in Syracuse/ Onondaga Lake area (currently being re-mediated), municipal waste water and combined sewer overflows in Syracuse and other urban areas, and agricultural and other non-point sources of nutrients and various other pollutants.

Solution

Most water-resource complications within the Oswego River Basin tend to be viewed upon as local water-level issues, property issues, water-quality issues or single-use issues. The obligation and challenge to water-resource managers and users is to view all issues within the framework of the whole basin-wide management. Only when the emphasis is on the entire system will the basin residents be able to outline sensible goals and work toward solving them.

For more information visit:

Click to access OswegoFingerLakesWatershed_info.pdf

IUCN Red List: What You Need to Know

Title Case Side

About the IUCN Red List:

The early beginnings of The IUCN Red List started in the 1950s with an index card system that was used to file data on endangered mammals and birds. In the early 1960s the index card was transformed into a two-volume set of data sheets. They were then presented in loose-leaf paper format within red binders and these drafts were not available for the general public. In 1964 the first comprehensive list of threatened mammals and birds was accumulated and published – permitting public access to the data. In 2000, The IUCN Red List was free supported by the internet, this was enabling broader access to figures and permitting for regular updates.

The IUCN Red List is the world’s most all-inclusive information source on the global conservation status of animal, fungi and plant species and their links to their niche within wildlife. For each evaluated species, The IUCN Red List provides information on population size and trends; topographical range and habitat requirements. To date more than 76,000 species have been assessed with more than 22,000 at risk of extinction. The IUCN Red List goal is to rise the number of species evaluated from the current count to at least 160,000 by 2020, improving the taxonomic coverage.

CITES treaty logo

About the CITES Treaty:

CITES (the Convention on International Trade in Endangered Species of Wild Fauna and Flora) is an international agreement between governments. Its aim is to ensure that international trade in specimens of wild animals and plants does not threaten their survival. When the ideas for CITES were first formed, in the 1960s, international debate of the guidelines of wildlife trade for conservation resolutions was something reasonably new. Annually, international wildlife trade is estimated to be worth billions of dollars and to include hundreds of millions of plant and animal specimens. The trade is diverse, ranging from live animals and plants to a vast array of wildlife products derived from them, including food products, exotic leather goods, wooden musical instruments, timber, and medicines. Levels of mistreatment of some animal and plant species are in elevation with trade, together with other factors, such as habitat loss, is capable of seriously depleting their populations and even bringing some species close to extinction. Many wildlife species in trade are not endangered, but the presence of a treaty to ensure the sustainability of the trade is important in order to safeguard these resources for the future.

african_penguin2

AfricanPenguin2

A species covered as an endangered species in the IUCN Red List is the African Penguin, Spheniscus demersus. It is confined to southern African waters and breeds at 25 islands and four mainland sites in Namibia and South Africa. This species of penguin is undergoing a very fast population decline, which led to its up listing to Endangered in 2010, this is largely attributed to food scarcities due to commercial fishing and environmental instabilities. Other threats consist of: egg collection, oil spills, competition with Cape Fur Seals, for food and displacement from breeding sites, mortality from fishing nets and predation by sharks, Kelp Gulls, and feral cats.

I found the IUCN website to be very helpful and educational in many aspects. The site was easy to navigate and extremely organized. The IUCN organization makes it really comprehensible to recognize their mission, and how you as the reader can make a difference in helping an actual endangered species, not just recognizing the flagship endangered species that the commercials portray.

Warning About Warming: Coral Reefs Threatened by Bleaching

coral bleaching pic 1

Unusually warm ocean temperatures are generating conditions that threaten to kill coral across the Pacific, North Pacific and Western Atlantic oceans. Coral bleaching occurs when coral is stressed by variations in its environment, causing it to release algae living in its tissue. The coral then turns pale or white and becomes more susceptible to disease. In severe cases, the coral can die, permanently changing the habitat for fish and shellfish.

coral bleaching pic 2

Ocean temperatures, light and nutrient levels can possibly cause bleaching. But NOAA says only warm temperatures can cause the widespread bleaching that scientists have been recording since last year. In 2014, Hawaii experienced widespread bleaching for the first time in virtually two decades. If it happens again this year, it would be the first time in history the Hawaiian Islands saw repeated years of bleaching.

coral bleaching pic 4 projections of coral bleaching

More than one-third of the world’s coral reefs this year are at risk from some level of bleaching. Reefs around Hawaii, Haiti, the U.S. Virgin Islands and Puerto Rico are among those that stand to suffer as ocean waters warm, with as many as 95 percent of U.S. corals exposed to possible bleaching conditions by the end of this year. Entirely, scientists expect more than 4,600 square miles of reef to be killed off by bleaching in 2015. The findings have caused NOAA to declare the third global coral bleaching event ever on record — the others having occurred in 1998 and 2010.

While climate change continues to drive rising ocean temperatures, researchers said, El Niño stands to worsen the bleaching effects this year.  El Niño Southern Oscillation is referred to as the cycle of warm and cold temperatures, as dignified by sea surface temperature, SST, of the tropical central and eastern Pacific Ocean. El Niño is goes together with high air pressure in the western Pacific and low air pressure in the eastern Pacific.

coral bleaching pic 5

            “The coral bleaching, brought on by climate change and coupled with events like the current El Niño, are the prime and most persistent threats to coral reefs around the world,” NOAA coral reef researcher Mark Eakin said in a statement. “What really has us concerned is this event has been going on for more than a year and our preliminary model projections indicate it’s likely to last well into 2016.”

coral_reef_and_tropical_fish-wallpaper-1280x768coral bleaching pic 7

Coral cover just one-tenth of the ocean floor, but they are home to 25 percent of known marine species. Coral reefs are a critical part of the ecosystem, and their health is vital to the ocean environment and need to be protected. Hopefully scientists can discover a way or society might have to consider polluting the earth less with CO2 from factories and auto mobile emissions contributing to global warming.

A Special Thanks to the Sustainability Panel

sustainability pic 1On Wednesday October 14th, 2015 a group of environmentalist speakers were kind enough to join my class for a question-answer discussion. The speakers were George Payne, Ryan Loysen, Kate Frazer, and Adam Maurer. All four had diverse environmentalist jobs in the (local) Rochester area. I learned that sustainability is a possibility in the near future. These activists are already making improvements to the local area by peaceful protests, maintaining the beauty of Monroe County parks, creating partnerships with top corporations in the area to help others, and exploring new forms of clean energy.

sustainability pic 7

sustainability pic 6

The first speaker was George Payne, a non-violence activist and the CEO and founder of Gandhi Earth Keepers International. His non-profit organization uses non-violent forms of protest to protect the rights of people in need and the environment. This organization essentially fights for the people and things that don’t have a voice. Last year around this time Payne organized a peaceful protest in a public park in Rochester, NY to demand fair and safe housing for “hard to place” homeless. At one point they faced 40 Rochester police officers before the Mayor called them off. Ultimately their non-violent effort brought to the surface some very important concerns from the City of Rochester. This act by George Payne and his organization shows that people can make a difference where ever they are from and do.

sustainability pic 4

The second speaker was Ryan Loysen, who is a Recreation & Environmental Education Coordinator at Monroe County Parks Department. He works for the Monroe County Parks Department (Environmental Services). Loysen has a tremendous amount of knowledge about environmental issues and services that need to be provided and solved for a park system to run functionally.

sustainability pic 3

Kate Frazer was the third speaker to join my class and she leads communications and marketing for The Nature Conservancy’s Central and Western New York Chapter, raising the organization’s visibility through earned media, events, digital and print products, marketing partnerships and social media. Prior to this role, she held positions including senior writer and associate director of marketing for the organization’s New England region. Kate is a passionate writer who also conducts storytelling and messaging workshops for teams across the Conservancy. Her most influential impact on an environmental issue was when Wegmans Food Markets and The Nature Conservancy decided to work together on an April 2014 recycling initiative in celebration of Earth Day. They set an aspiring goal to break last April’s record of 177,200 pounds of recycled plastic bags. This is the correspondent of about 11 million new bags. For every pound recycled over that quantity, Wegmans would give 50 cents to The Nature Conservancy, the leading organization working around the world to protect lands and waters for nature and people.

sustainability pic 8

The last speaker to join my class that day was Adam Maurer, who is the sustainability manager for Hobart William Smith College in Geneva, NY. Recently Hobart William Smith College has been working toward exploring solar energy. “This is an amazing opportunity for the Colleges to use a newly-acquired piece of property to offset emissions due to our electricity use, provide revenue for the institution, and provide curricular opportunities for HWS students and faculty,” says Adam Maurer, sustainability manager. Maurer continues, “We’re fortunate to have the necessary ingredients to make this project a reality here in Geneva.” In addition, Hobart and William Smith Colleges are projected to see roughly $75,000 in annual energy electric savings, and nearly $1.5 million over the 20-year-term of the projected project.

sustainability pic 2                 Sustainability pic 5

I want to thank the panel for taking time out of their busy career schedules to speak with my class and give my classmates and myself more information on their careers and the routes at which they had to take to achieve their positions and quality of life today. I was surprised to hear that most of the panel had not planned to be where they are as college graduates. Their jobs in a way found them. After the discussion of the panel I can’t see myself making a career in sustainability, but I can most certainly see myself respecting the earth in my day to day life and all of its inhabitants like this panel chooses to do everyday.

http://www.gandhiearthkeepers.org/

http://professor.trustoria.com/Instructional-Coordinator/Rochester-NY

http://www.nature.org/ourinitiatives/regions/northamerica/unitedstates/newyork/contact/cwny-meet-the-staff.xml

http://partnersforsustainability.org/curriculum/maurer.php

http://www.hws.edu/dailyupdate/NewsDetails.aspx?aid=18267

The Push for Natural Gas Vehicles in America

CNG-car 3

Environmental Benefits

Natural gas is the cleanest burning alternative transportation fuel available today that can economically power light-medium, and heavy-duty vehicles as well as many non-road vehicles, such as rail and marine vehicles. Whether in the form of compressed natural gas (CNG) or liquefied natural gas (LNG), natural gas is a proven alternative fuel that significantly improves local air quality and reduces greenhouse gases (GHG).

Natural gas rises and disperses quickly, so in the event of a leak or emergency venting, surrounding ecosystems and water systems are not threatened.

CNG-car 2

Emission Benefits

Natural gas vehicles (NGV), as well as diesel and gasoline vehicles, are delivering superior emissions compared to what was achievable just a few years ago. An NGV that has continued to provide improved emissions throughout the years is the Honda Civic Natural Gas. The CNG-powered Civic was once characterized by EPA as the cleanest commercially available internal-combustion vehicle on earth. Compared to its gasoline-burning counterpart, the 2013 version of the Civic Natural Gas produces 80 percent fewer emissions of non-methane hydrocarbons and 50 percent fewer emissions of nitric oxide (NO), which contribute to ozone depletion. It also produces 67 percent less carbon monoxide than gasoline.

The light-duty Honda Civic Natural Gas held the American Council for An Energy-Efficient Economy’s (ACEEE) title of “Greenest Vehicle” for eight consecutive years.

Natural gas vehicles generally emit 13-21 percent fewer GHG emissions than comparable gasoline and diesel vehicles. Natural gas primarily consists of methane (around 90 percent), with small amounts of ethane, propane, and other gases. Methane is lighter than air and burns almost completely, creating carbon dioxide and water as by products.

Greenhouse Gas Emissions

            Natural gas contains less carbon than any other fossil fuel and in turn produces fewer carbon dioxide (CO2) emissions when burned. While natural gas vehicles do emit methane, another principle greenhouse gas, the increase in methane emissions is more than offset by a substantial reduction in CO2 emissions. The California Air Resources Board (CARB) has conducted extensive analysis on this issue. CARB concludes that CNG fueled vehicle emits 20 to 29 percent fewer greenhouse gas emissions than a comparable gasoline or diesel fueled vehicle. For natural gas vehicles that run on bio methane, the greenhouse gas emissions reduction approaches 90 percent.

CNG-car drive

Economic Benefits

The compressed natural gas industry helps to support US jobs and the economy and creating reduced fuel prices. Natural gas represents almost a 50% savings over petroleum products such as gasoline and diesel fuel. Over the last decade, the average cost per gallon of gasoline in the United States has risen approximately 140%. In 2004, the average price per gallon of gasoline was $1.50, today the average price is around $3.60, and the costs are expected to continue to rise. In a very competitive economy, there is no better time to look for alternative ways to fuel our vehicles.

Overall, compressed natural gas and liquefied natural gas are both clean-burning and perform well against current vehicle emissions standards. Though using natural gas for vehicle fuel is more efficient, benefits the economy, and cleaner for the air; it is still a fossil fuel, so there is not an unlimited supply available for our disposal.

http://automobiles.honda.com/civic-natural-gas/

http://www.cngnow.com/vehicles/Pages/information.aspx

http://www.bankrate.com/finance/auto/natural-gas-vehicles.aspx

https://www.eqt.com/our-business/commercial-operations/natural-gas-vehicles/natural-gas-fueling-station

Cause and Effect: The ‘Super Moon’ Lunar Eclipse

blood moon

A rare astronomical phenomenon Sunday night created a moon that appeared slightly larger than usual and with a reddish hue, an event known as a super blood moon. It’s a combination of curiosities that hasn’t happened since 1982, and won’t occur again until 2033. A super moon, which occurs when the moon is closest to earth in its orbit, will correspond with a lunar eclipse, leaving the moon in Earth’s shadow. Individually, the two phenomena are not uncommon, but they do not align often.

Celestial events have a long history of producing fear. Stories abound of how this super-moon will be enormous in the sky, that it could trigger earthquakes, that the blood red color is a sign of doom, and the fact that this one is the fourth in a series called a Tetrad must mean some kind of apocalyptic ending.

First, let’s clear up your understanding of the super moon.

The moon’s orbit around the Earth is an ellipse rather than a perfect circle, so the distance to the moon can vary by more than 50,000 kilometers. Last weekend, the moon was at its closest point, so it appeared 30 percent brighter and 14 percent larger than during normal moonlit nights. That may sound like a lot, but that’s 14 percent of something that is very small for the human eye to recognize. But the reddish tint from the lunar eclipse was to be more visible throughout much of North America, especially on the East Coast. “You’re basically seeing all of the sunrises and sunsets across the world, all at once, being reflected off the surface of the moon,” said Dr. Sarah Noble, a program scientist at NASA.

blood moon 3

So there is no correlation between super moons and earthquakes, although tides were definitively higher and stronger last weekend. Because the tides are influenced by both the Moon and the Sun, it’s easy to see that when the Sun lines up with the Moon and the Earth, as during a New Moon or Full Moon, the tidal effect is increased. These are known as spring tides, named not for the season, but for the fact that the water “springs” higher into the air than normal.

The key to how the tides work is understanding the relationship between the motion of our planet and the Moon and Sun. As the Earth spins on its own axis, ocean water is kept at equal levels around the planet by the Earth’s gravity pulling inward and centrifugal force pushing outward. However, the Moon’s gravitational forces are strong enough to disrupt this balance by accelerating the water towards the Moon. This causes the water to ‘bulge’ as the Moon orbits our planet and as the Earth rotates, causing bulge to move in relation. The areas of the Earth where the bulging occurs experience high tide, and the other areas are subject to a low tide.

Blood Moon 001

Although this was a beautiful phenomenon to experience, everything has a cause and effect.  For me, I was lucky enough to capture a few pictures through breaks in the clouds.  Although not as dramatic as some of the photos seen on the news and on the internet, the event was both interesting and memorable.


http://www.endtime.com/four-blood-moons/

http://www.space.com/25427-blood-moons-lunar-eclipse-tetrad-infographic.html

http://earthsky.org/earth/tides-and-the-pull-of-the-moon-and-sun

http://oceanservice.noaa.gov/education/kits/tides/tides02_cause.html